Benchmarks
Find out how fast IdeaFIX can run
Methodology
There are so many ways to benchmark a network application but the best is to focus on a realistic scenario and make sure that numbers are comparable across similar products. The focus of a trading application is on response times or end-to-end latency.
The method we used involves writing a client that sends one order (NewSingleOrder type 35=D) and receives 2 execution reports (type 35=8), one acknowledgement and one fill report. After which, another new single order is sent until the timer expires. Server and client are running on the same host.
It’s a simple but realistic ping-pong setup that is suitable for capturing all sources of latencies. It allows a platform-neutral comparison between FIX engines.
An analysis script then process the message history to estimate the mean round trip time (RTT), its distribution, standard deviation and percentiles using a bootstrap method.
The SDK contains a benchmark folder with 2 scripts one for QuickFIX/J and one for IdeaFIX. With them, users can reproduce performance numbers on their environment before moving forward.
The study is divided into 2 steps
IdeaFIX vs QuickFIX/J
IdeaFIX
Here are the numbers for IdeaFIX on a medium bare metal instance at OVH. UDS was used with OS tuning :
population mean = 9270.92 ns
sampled mean = 9264.42 ns
std dev. = 791.77 ns
sample size = 599
Percentiles:
	1.00th percentile = 8986.82 ns
	5.00th percentile = 9046.34 ns
	50.00th percentile = 9233.81 ns
	90.00th percentile = 9414.93 ns
	95.00th percentile = 9473.44 ns
	99.00th percentile = 9620.48 ns
	99.99th percentile = 45372.42 ns
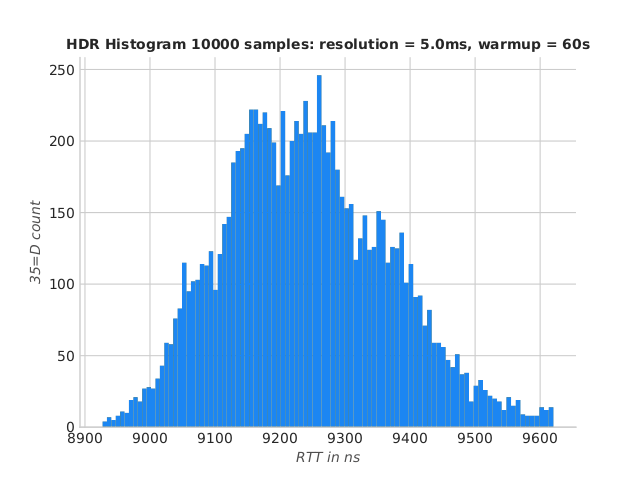
IdeaFIX RTT histogram
Quickfix/J
Here are the numbers for QuickFIX/J on the same instance (TCP) :
population mean = 60155.44 ns
sampled mean = 60341.26 ns
std dev. = 4656.07 ns
sample size = 104
Percentiles:
	1.00th percentile = 56689.39 ns
	5.00th percentile = 57100.56 ns
	50.00th percentile = 58578.18 ns
	90.00th percentile = 67866.25 ns
	95.00th percentile = 69053.48 ns
	99.00th percentile = 74685.56 ns
	99.99th percentile = 116496.26 ns
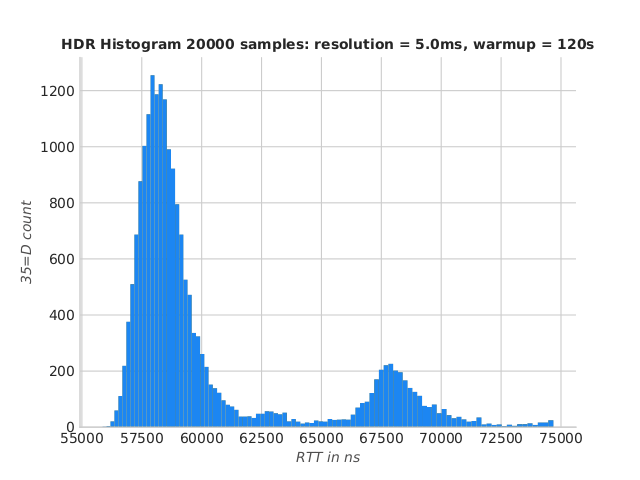
QuickFIX/J RTT histogram
Conclusions
Two main observations can be made :
- IdeaFIX’s mean RTT is ~ 6.5x smaller than QuickFIX/J’s !
- IdeaFIX’s response times are predictable and centered around the mean.
A lot of effort has been put in the threading model, the lock-free architecture and low allocation rate, precisely to insure predictable response times. On the other hand, QuickFIX/J uses coarse-grained locks, sleeps, high allocation rate with higher GC usage, etc. These are the main causes of RTT jitter.
On a last note, this also demonstrates that, with current JVMs, GC activity is a moderate source of latencies (in the ~µs range) compared to I/O (mostly network), thread sleeps and context switching. It’s a widespread misunderstanding in financial technology.
The IdeaFIX run above is, in fact, running the GC at a low frequency but the OS scheduler with the extra core count manages to mitigate its effect. In effect, the RTT variance stays very low.
Saying that, IdeaFIX does include a GC-free mode. That means, however, that the client code also has to be garbage-free wich brings significant design challenges.
IdeaFIX on high-end specs
Configuration
For this in-depth benchmarking, I’ve chosen to go for a dedicated bare metal AX102 server @ Hetzner running debian 12
AMD Ryzen 9 7950X3D 16-Core Processor
128GiB System Memory
1920GB NVMe disk SAMSUNG MZQL21T9HCJR-00A07
I’ll follow the instructions in the install script in the SDK debian_setup_script
Out of the box, the debian linux kernel is not fully optimised for this recent hardware. With a back-ported kernel, it’s easy to get significant boost but I chose to go for a fully re-compiled kernel and I used the linux tkg repo
git clone https://github.com/Frogging-Family/linux-tkg.git
cd linux-tdg
./install.sh install
Default parameters are very good. The CPU generation is zen4 and I went for a fully tickless kernel.
Now time to add a few boot-time parameters by editing /etc/default/grub
GRUB_CMDLINE_LINUX_DEFAULT="consoleblank=0 quiet threadirqs transparent_hugepage=never nosoftlockup audit=0 mitigations=off processor.max_cstate=1 mce=ignore_ce preempt=none"
It’s relatively safe to switch off CPU mitigations on recent hardware since it will include vulnerability fix directly on the chip, preempt=none switch the preemption model to server.
I’ve added more runtime linux parameters to the sysctl.conf
vm.nr_hugepages = 16384
vm.dirty_background_ratio = 3
vm.dirty_ratio = 6
vm.swappiness = 10
vm.vfs_cache_pressure = 50
vm.stat_interval = 120
vm.max_map_count = 262144
Huge pages offer a ~5% boost to performances, so it’s worth a try. The rest make sure the kernel postpones hard-drive flushes as much as possible to avoid freezes during high I/O
This analysis is divided into 4 independent runs using the parameters of the benchmark script
- Low-GC IdeaFIX using Unix Domain Sockets (default)
- No-GC IdeaFIX using UDS
- Low-GC IdeaFIX using TCP
- Low-GC IdeaFIX using UDS and SSL (encryption)
Low-GC IdeaFIX using UDS
This is the default and offer theorically the best average latencies
population mean = 5584.45 ns
sampled mean = 5605.06 ns
std dev. = 874.77 ns
sample size = 995
Percentiles:
	1.00th percentile = 5478.89 ns
	5.00th percentile = 5501.84 ns
	50.00th percentile = 5579.58 ns
	90.00th percentile = 5637.49 ns
	95.00th percentile = 5650.89 ns
	99.00th percentile = 5707.27 ns
	99.99th percentile = 42076.89 ns
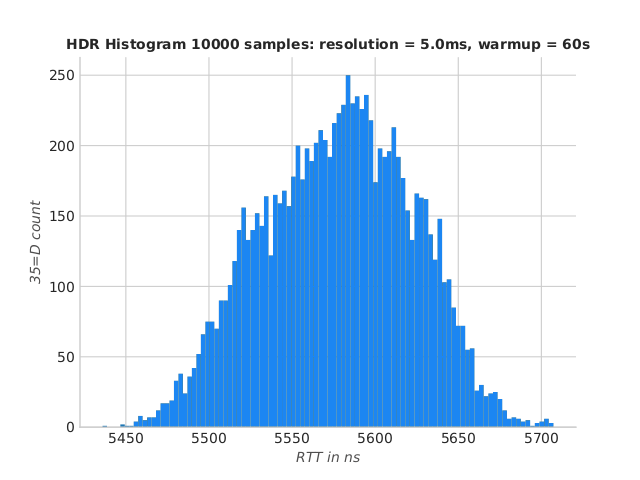
IdeaFIX Ryzen UDS RTT histogram
This option offers the best performances with an outstanding 5.5µs round trip time !
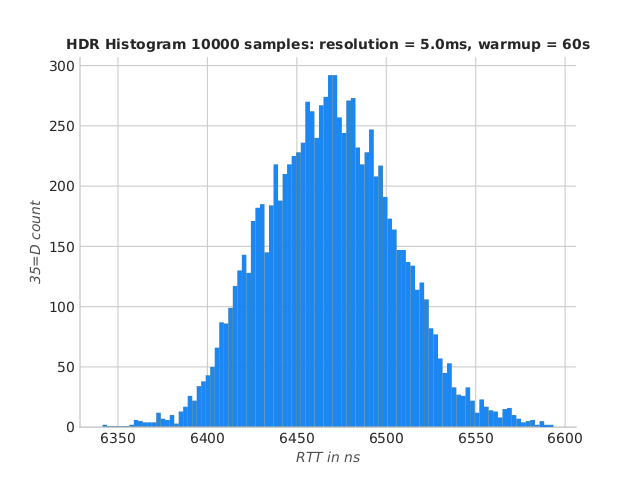
No-GC IdeaFIX using UDS
How do we improve on the 99.99th percentile ? While not covered here pinning a few cores to the process would help. For a start, let’s run the no-GC variant of the benchmark
population mean = 6378.49 ns
sampled mean = 6375.83 ns
std dev. = 287.28 ns
sample size = 871
Percentiles:
	1.00th percentile = 6222.26 ns
	5.00th percentile = 6254.81 ns
	50.00th percentile = 6342.56 ns
	90.00th percentile = 6500.65 ns
	95.00th percentile = 6586.33 ns
	99.00th percentile = 6908.17 ns
	99.99th percentile = 17483.62 ns
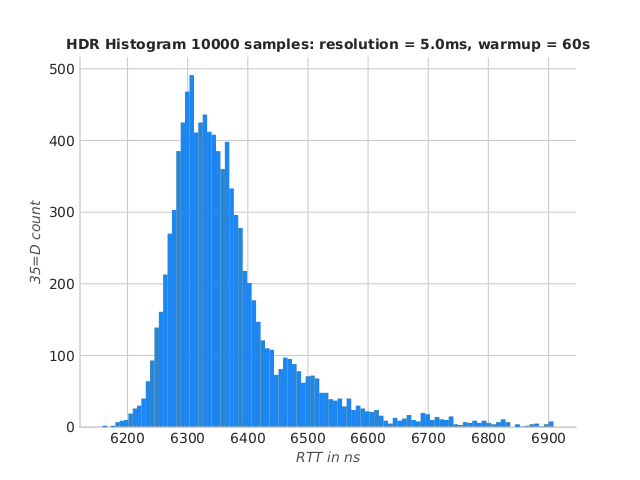
IdeaFIX Ryzen no-GC UDS RTT histogram
The 99.99th percentile is down to 17,4µs at the expense of the average latencies. There’s no magic, running a garbage-free code has a cost (mostly maintaining object pools for re-use)
Low-GC IdeaFIX using TCP
Now let’s estimate the overhead of TCP in a real-word scenario
population mean = 6481.32 ns
sampled mean = 6503.30 ns
std dev. = 1065.18 ns
sample size = 857
Percentiles:
	1.00th percentile = 6389.00 ns
	5.00th percentile = 6410.28 ns
	50.00th percentile = 6468.54 ns
	90.00th percentile = 6517.20 ns
	95.00th percentile = 6531.32 ns
	99.00th percentile = 6593.46 ns
	99.99th percentile = 51253.29 ns
IdeaFIX Ryzen TCP RTT histogram
Compared to the first run, TCP incurs a cost of less than 1µs ! On high-end specs, IdeaFIX matches the performance of the best FIX engines.
Low-GC IdeaFIX using UDS and SSL
And finally, let’s have a look to SSL (end-to-end encryption). Does SSL really slow down IdeaFIX ?
population mean = 7878.76 ns
sampled mean = 7907.42 ns
std dev. = 1299.67 ns
sample size = 705
Percentiles:
	1.00th percentile = 7721.67 ns
	5.00th percentile = 7749.47 ns
	50.00th percentile = 7852.39 ns
	90.00th percentile = 7967.13 ns
	95.00th percentile = 8000.61 ns
	99.00th percentile = 8097.16 ns
	99.99th percentile = 59140.95 ns
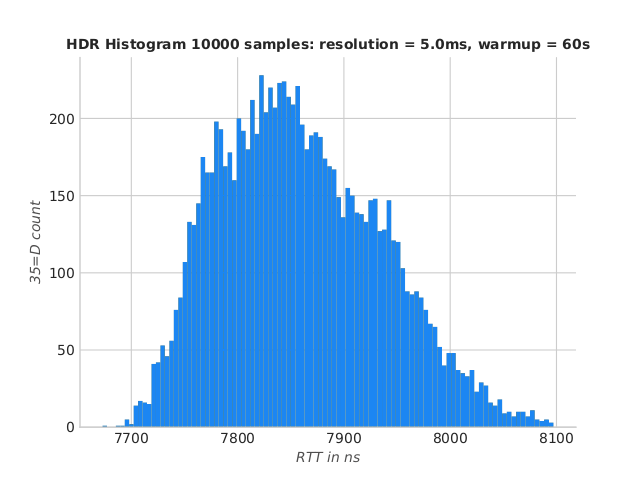
IdeaFIX Ryzen UDS SSL RTT histogram
Results are excellent in this benchmark ! Compared to the first run, SSL overhead is estimated to 2.5µs.
Conclusions
IdeaFIX results are excellent on high-end specs with a round trip time that lands it in the top spots compared to publicly-available benchmarks. TCP overhead is mininum at less than 1µs and SSL only adds 2.5µs to the RTT.
What would be interesting to do next ?
- Investigate the effect of kernel-bypass technologies such as OpenOnLoad but this requires dedicated network cards
- Research the effect of pinning a core to each of IdeaFIX threads. This would theoritically improve the highest percentiles
